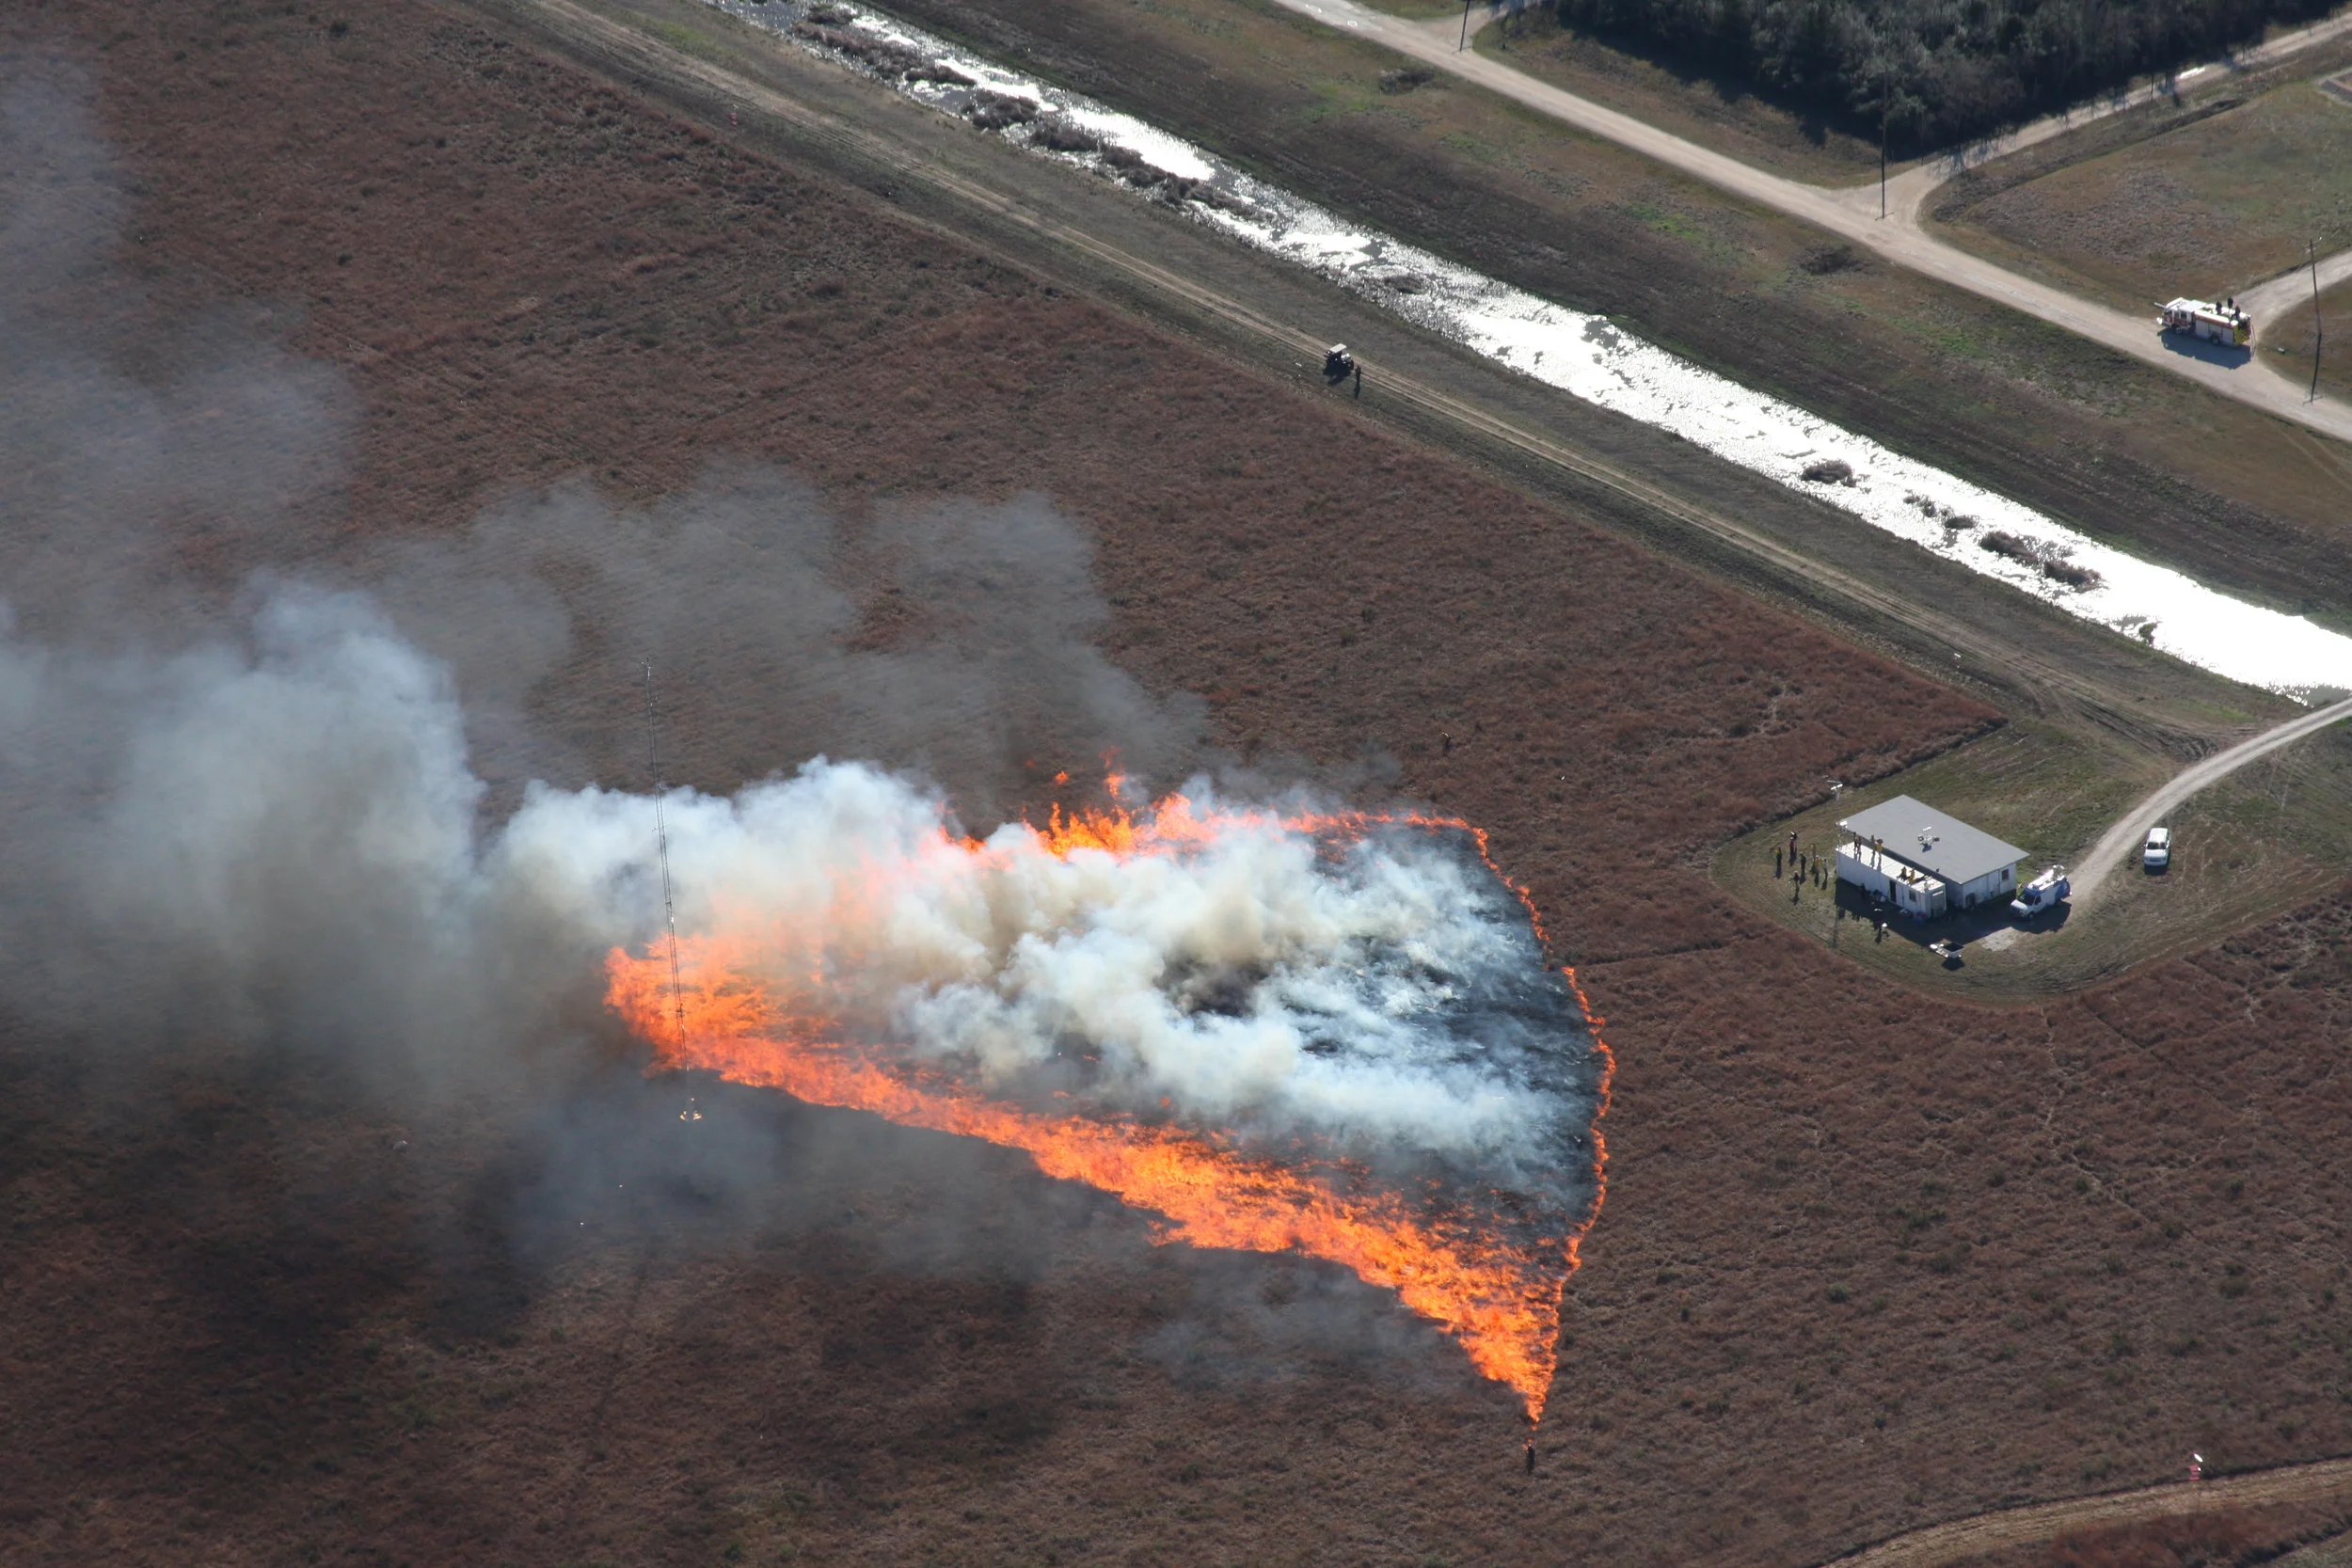
Video of observed fire behavior during the experiment.
The FireFlux II fire experiment was recorded using two synchronized GoPro cameras placed on two towers.
The Fireflux II experiment, conducted at the same site as the 2006 FireFlux campaign, saw a marked increase in the amount of instrumentation and data collected for a control burn experiment. Instrumentation included:
A 43-m micrometeorological tower;
Three 10-m micromet towers;
The CSU-MAPS telescoping 32-m tower, equipped with T/RH sensors and sonic anemometers;
24 cup & vane anemometers surrounding the burn perimeter;
A short-range and a mid-range sodar;
A doppler lidar;
A microwave profiler;
The University of Houston mobile aerosol lab;
18 pressure sensors, designed by our lab; and
24 in-ground HOBO temperature sensors.
Each tower was equipped with a variety of sensors, including 3-D sonic anemometers, T/RH sensors, pressure sensors, net radiometers, and a vertical profile of thermocouples, etc.
Wind Field Composite—surface winds associated with a fast-spreading grass fire during Red Flag Warning
By combining Doppler lidar, tower, and anemometer data into a georeferenced time series, our research shows a composite of surface winds, atmospheric surface pressure (shading), and fire front positions (black circles, larger = hotter). The composite animation shows the wind field associated with a fast-moving fire during Red Flag Warning Conditions.


